Operations with Dashboards
This section describes all operations that an Admin user can perform with Dashboards.
What are dashboards in Inimco.facts?
A dashboard is a customisable visual display that shows real-time telemetry data from devices within an organisational unit or subscription. Dashboards are composed of widgets that can be customised according to the specific needs and preferences of the user.
The widgets include:
-
Latest State Widget: It displays the most recent telemetry data from a chosen device. Users select a device and its capability to view the latest data, with optional conditional formatting to highlight values when certain conditions are met.
-
Line Chart Widget: It visualizes historical telemetry data in a line chart format. Users can select multiple devices and capabilities to plot over time, along with data aggregation and time range options.
-
Bar Chart Widget: Similar to the Line Chart, this widget displays historical telemetry data but in a bar chart format. Users select devices, capabilities, and configure the aggregation type, time range, and visualization preferences.
-
Microsoft 365 Widget: It allows integration of Microsoft 365 documents into the dashboard, displaying content directly in the IoT Central interface with the help of an embed code from the Microsoft 365 platform.
-
Power BI Widget: This widget integrates Power BI reports or dashboards into the IoT environment, offering embedded analytics and visualizations that are selectable based on established Power BI service connections.
-
Embedded Application Widget: It enables the embedding of external applications within the dashboard through a direct URL, allowing users to interact with third-party services or platforms directly within IoT Central.
-
Value Chart Average Widget: It shows the average value of a selected metric over a chosen time frame and provides options for displaying minimum and maximum values and for adding conditions to filter and highlight data points.
-
Heat Map Widget: It offers a heat map representation of data, using color variations to display the intensity or frequency of data points across two dimensions, allowing for easy spotting of trends and patterns.
-
Value Chart Sum Widget: This widget focuses on the sum of data points for a selected metric, also displaying average, minimum, and maximum values, with options for rounding and condition-based filtering.
-
Donut Chart Widget: It presents data in a donut chart format, allowing users to see proportions and relationships between different data segments or metrics, with options for aggregation and organizational filtering.
What can we do with dashboards in Inimco.facts?
Dashboard Management
-
Create a Dashboard: Build a new dashboard to suit specific monitoring requirements.
-
Edit a Dashboard: Modify the name of an existing dashboard for clarity or updated purposes.
-
Delete a Dashboard: Remove an entire dashboard that is no longer necessary.
Widget Management
-
View Device Data: Use widgets to display real-time or historical data from devices.
-
Set Up Widgets: Configure various widgets, such as Latest State, Line Chart, Bar Chart, Microsoft 365, Power BI, Embedded Application, and various analytical charts like line, bar, and pareto, to visualize different data aspects.
-
Edit a Dashboard Widget: Adjust widget settings to change how data is displayed.
-
Delete a Dashboard Widget: Remove widgets that are no longer relevant to the dashboard’s function.
Procedures
Create a dashboard
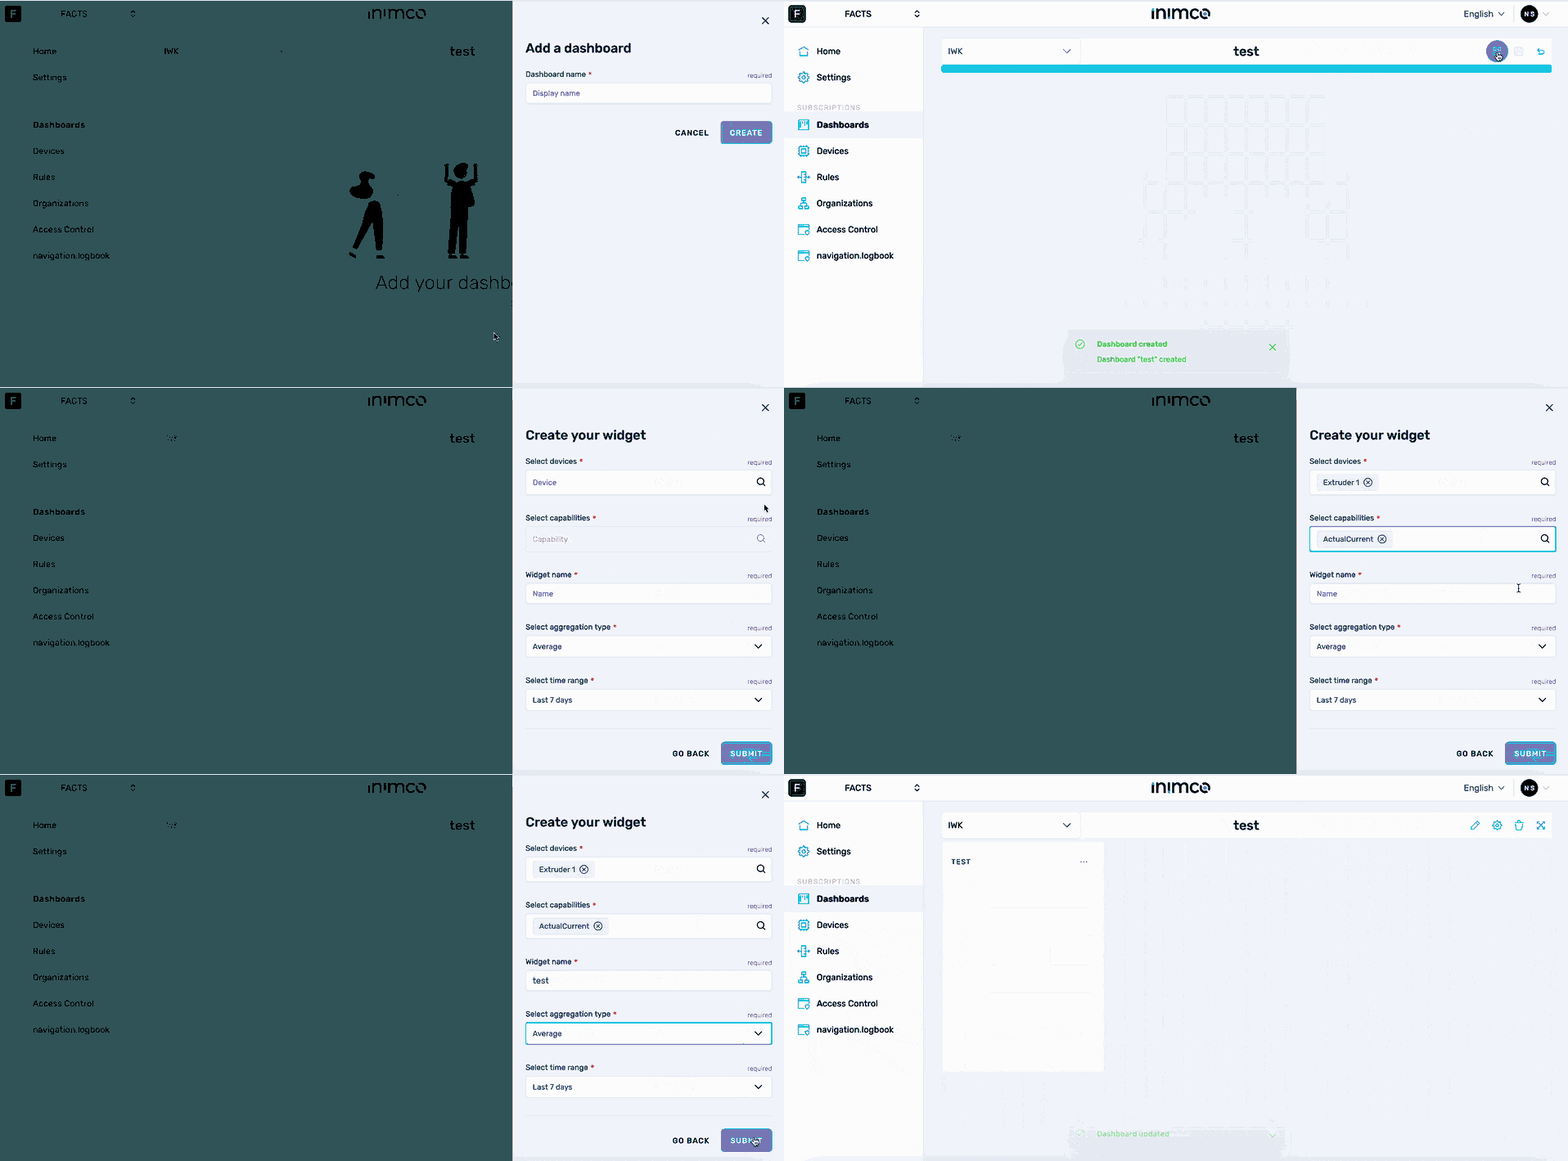
- Log in to Inimco.facts. You will be taken to the Manage Devices screen.
- Navigate to Dashboards.
- Click Create dashboard.
- Enter the dashboard name into the Dashboard name field.
- Click Create.
- Click Edit dashboard.
- Click the pencil icon in the top right corner.
- Select the required widget type.
- Click Next.
- Fill out the required widget parameters as described in Widgets.
- Click Submit.
- Click Save.
Edit a dashboard name
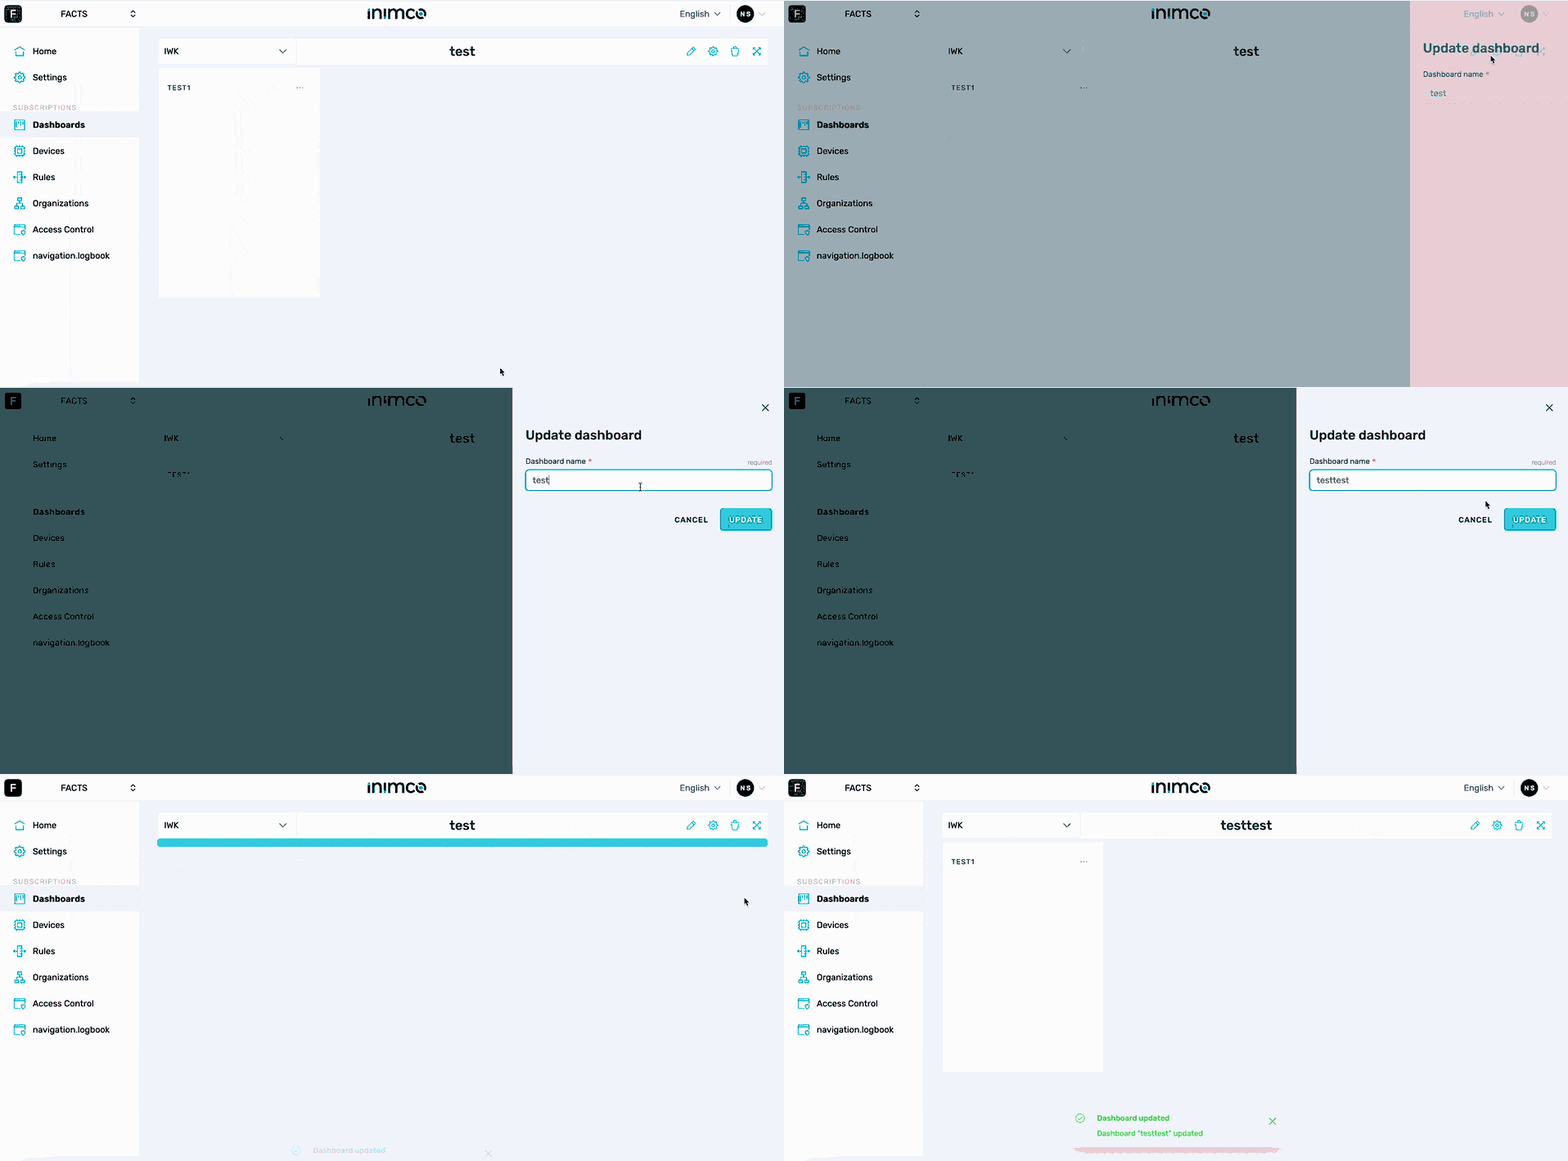
- Log in to Inimco.facts. You will be taken to the Manage Devices screen.
- Navigate to Dashboards.
- Click the gear icon in the top right corner.
- Enter the new dashboard name into the Dashboard name field.
- Click Update.
Edit a dashboard widget
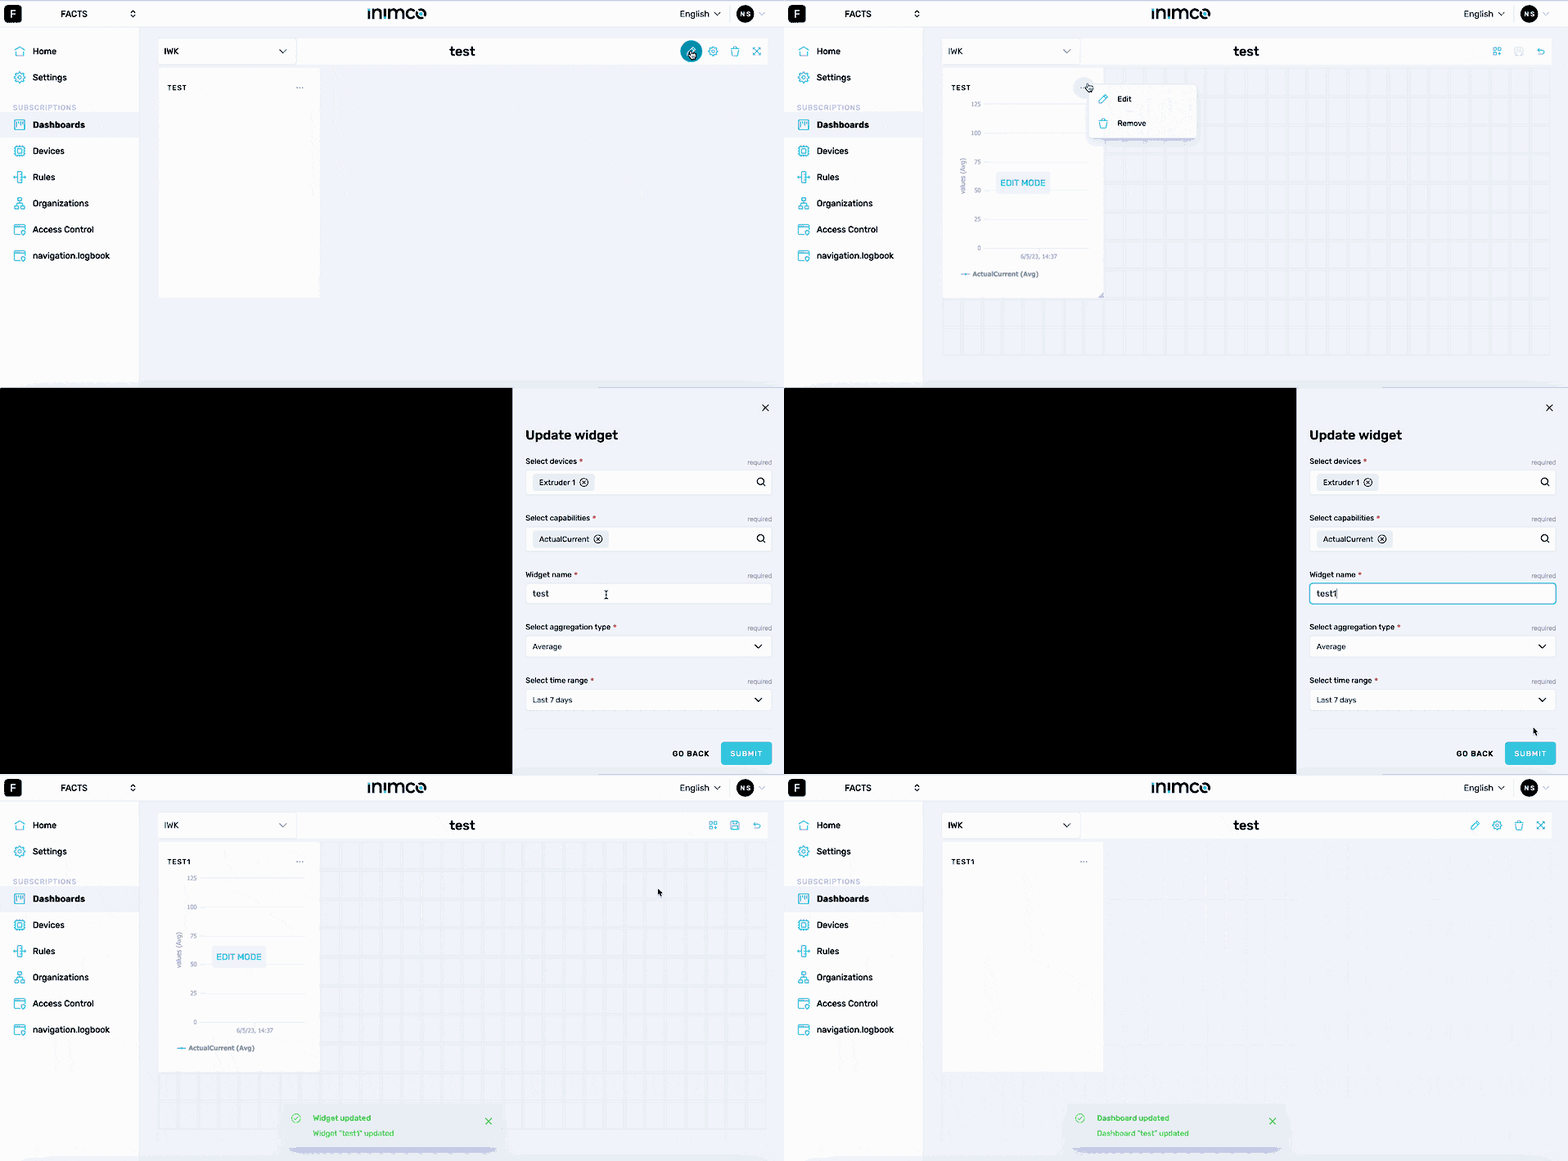
- Log in to Inimco.facts. You will be taken to the Manage Devices screen.
- Navigate to Dashboards.
- Click the gear icon in the top right corner.
- Click the ellipsis (...) in the top right corner of the widget you need to edit.
- Click Edit.
- Fill out the required widget parameters as described in Widgets.
- Click Submit.
- Click Save.
Delete a dashboard widget
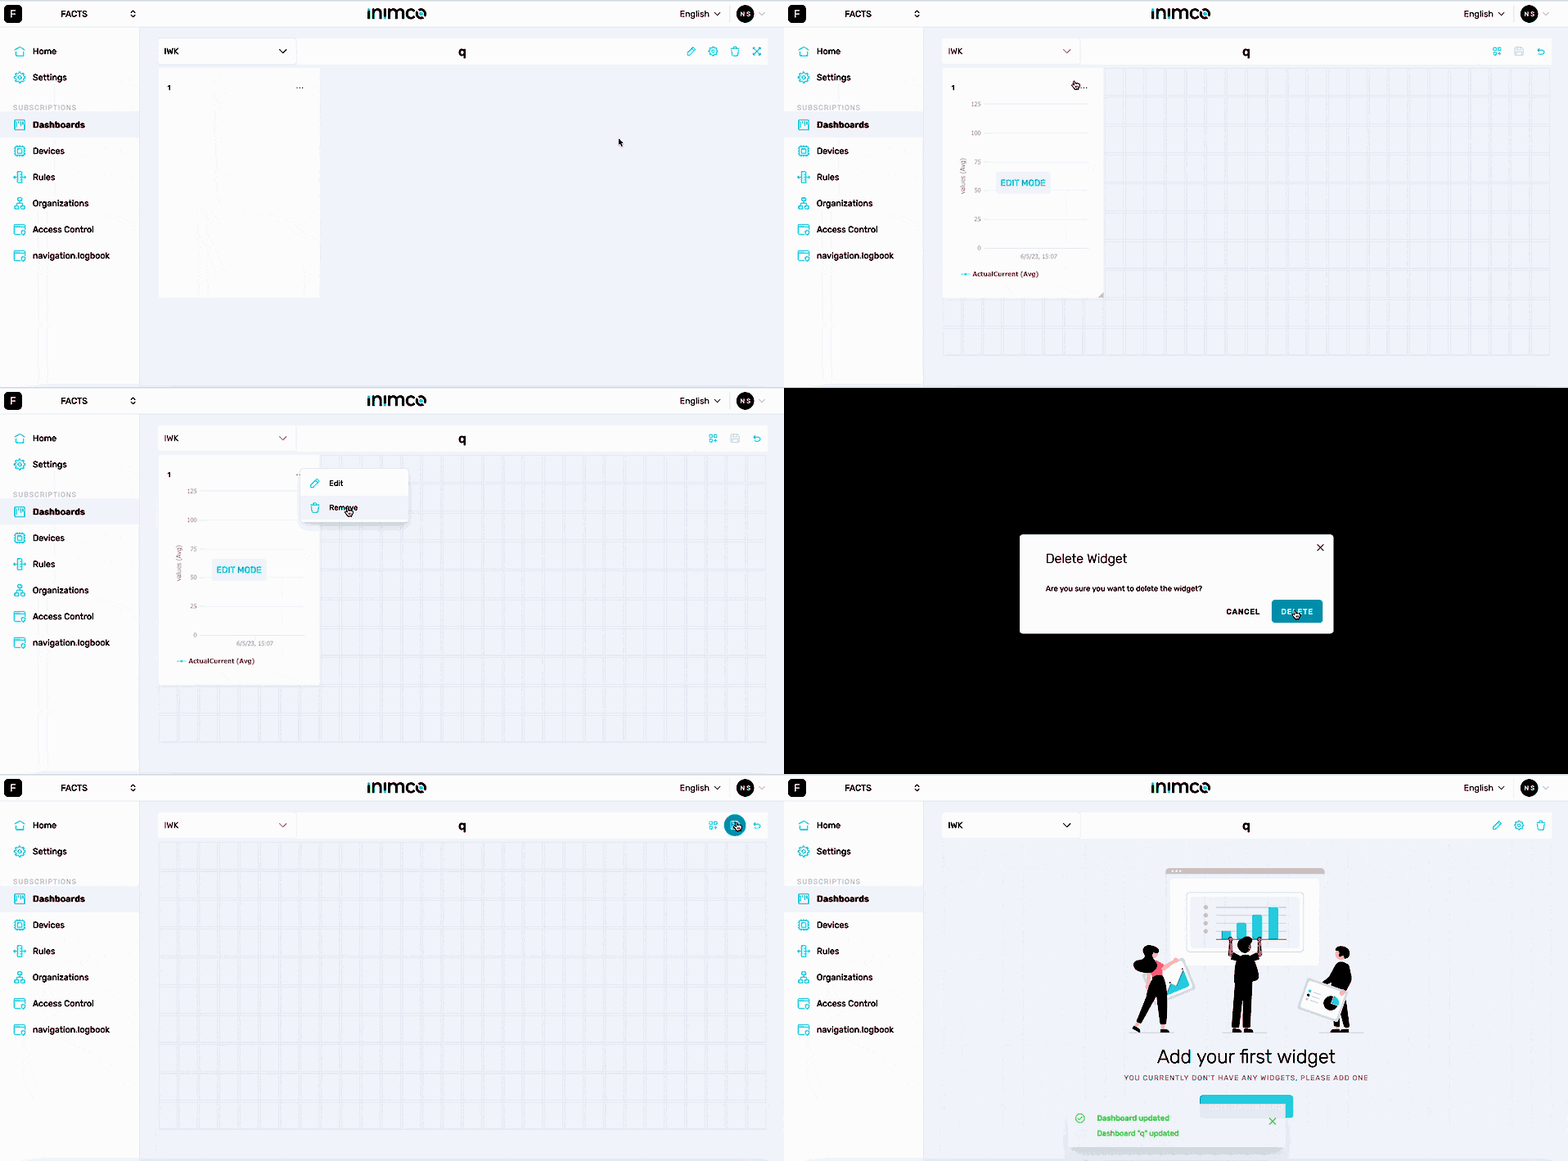
- Log in to Inimco.facts. You will be taken to the Manage Devices screen.
- Navigate to Dashboards.
- Click the gear icon in the top right corner.
- Click the ellipsis (...) in the top right corner of the widget you need to edit.
- Click Delete.
- Confirm deletion.
- Click Save.
Delete a dashboard
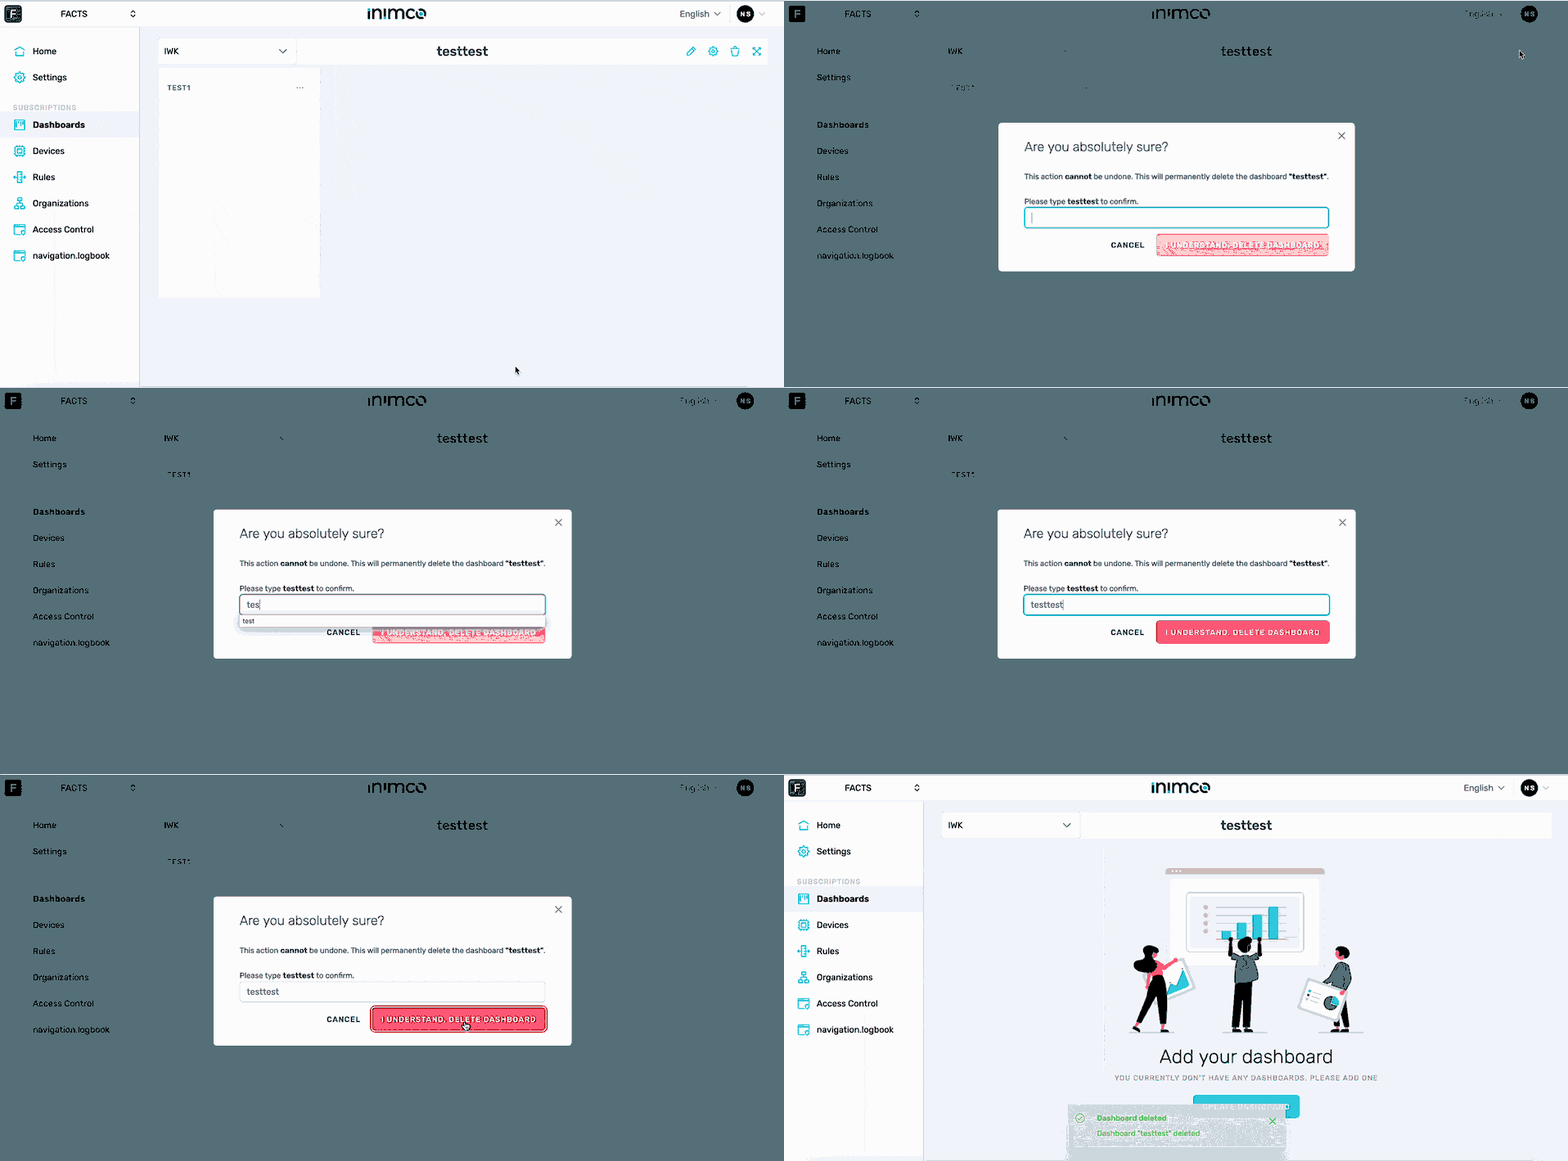
- Log in to Inimco.facts. You will be taken to the Manage Devices screen.
- Navigate to Dashboards.
- Click the bin icon in the top right corner.
- Type in the dashboard name.
- Click I UNDERSTAND, DELETE DASHBOARD.